New York Giants vs Chicago Bears Match Player Stats
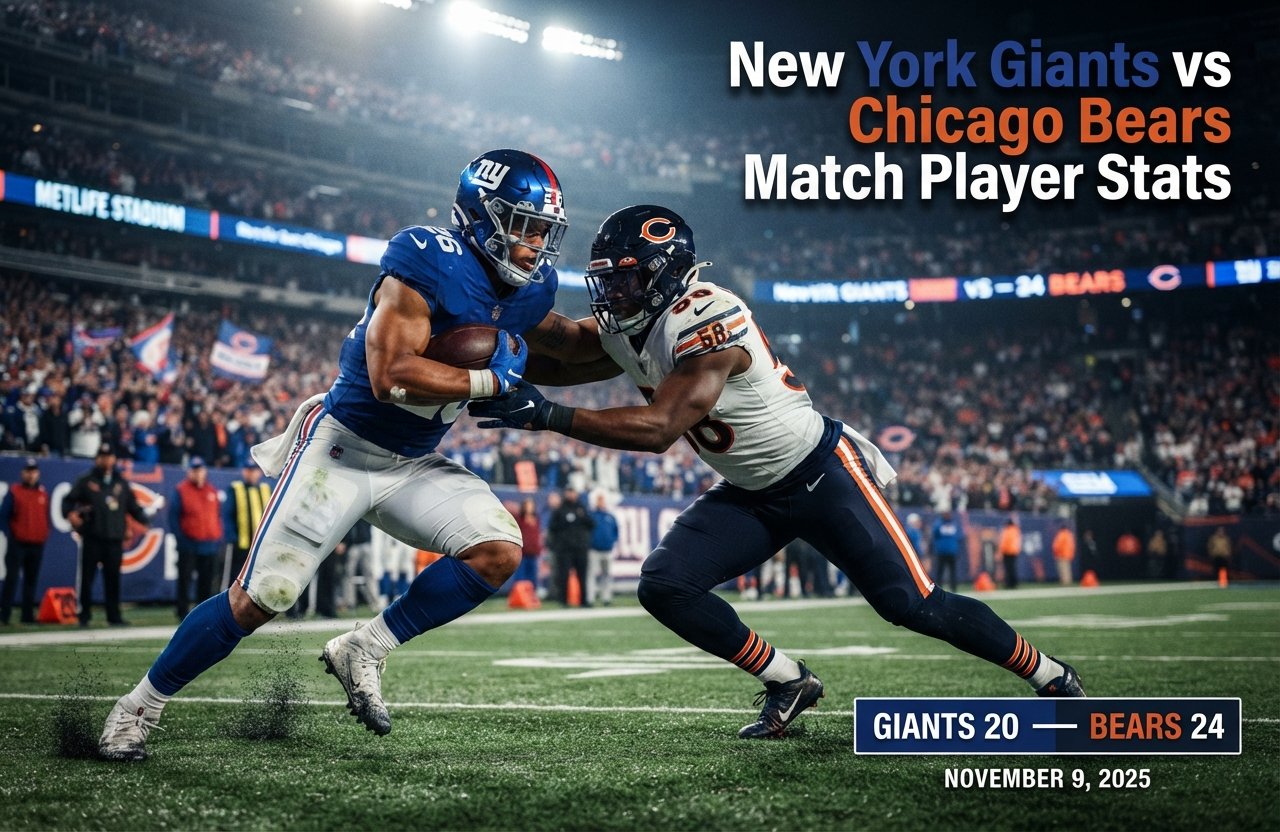
The new york giants vs chicago bears match player stats from November 9, 2025, tell the story of a close NFL contest that ended with the Chicago Bears defeating the New York Giants 24-20. Chicago secured the victory with a strong fourth-quarter performance, while New York combined productive passing and rushing numbers with an offense that struggled to finish drives through the air. Jaxson Dart was a major part of the Giants’ offensive production, recording 242 passing yards and two rushing touchdowns. For Chicago, Caleb Williams contributed through the air and on the ground, D’Andre Swift led the rushing attack, and Rome Odunze delivered the team’s only receiving touchdown.
The final score alone does not explain how the game unfolded. The Giants gained more passing yards and nearly matched Chicago’s rushing production, yet the Bears recorded four sacks and scored 14 points in the fourth quarter. Examining the quarterback statistics, rushing efficiency, receiving performances, defensive pressure, and scoring sequence reveals why Chicago emerged with the win and what the numbers say about both teams’ performances.
This article breaks down the available ESPN box-score data, explains the most important individual performances, and highlights the statistical differences that shaped the result.
New York Giants vs Chicago Bears Match Player Stats: Game Overview
The matchup took place on November 9, 2025, with Chicago hosting New York. The Bears finished ahead by four points, turning a game in which they were shut out in the second quarter into a late comeback victory.
New York Giants
Away team
20 – 24
Final
Chicago Bears
Home team
Game date
November 9, 2025
Venue designation
Chicago, home team
Giants record listed
2-8
Bears record listed
6-3
Source: ESPN box score, game ID 401772875.
Final score by quarter
| Quarter | New York Giants | Chicago Bears |
| First quarter | 0 | 7 |
| Second quarter | 10 | 0 |
| Third quarter | 7 | 3 |
| Fourth quarter | 3 | 14 |
| Final score | 20 | 24 |
The scoring pattern is one of the most revealing parts of this game. Chicago opened with seven points, but New York responded with 10 unanswered points in the second quarter. The Giants added another seven in the third, giving them a 17-10 lead entering the final period.
Chicago then scored 14 fourth-quarter points while New York managed only a field goal. That eight-point difference in the final quarter was enough to decide the contest.
The figures establish the central theme of the game: New York was competitive for three quarters, but Chicago produced the stronger finish.
Complete Passing Statistics
Quarterback performance is often judged by passing yards and touchdowns, but those two figures do not tell the entire story. Completion rate, sacks, turnovers, rushing production, and performance in crucial situations all help explain how a quarterback contributed to the result.
New York Giants quarterback stats
| Player | Comp/Att | Pass Yds | Yards per Attempt | Pass TD | INT | Sacks Taken |
| Jaxson Dart | 19/29 | 242 | 8.3 | 0 | 0 | 2 |
| Russell Wilson | 3/7 | 45 | 6.4 | 0 | 0 | 2 |
| Team total | 22/36 | 287 gross | 8.0 | 0 | 0 | 4 |
Passing yards shown for the team are gross passing yards. The Giants finished with 262 net passing yards after sack losses.
Jaxson Dart: Productive passing with major rushing impact
Dart completed 19 of 29 passes, a completion rate of approximately 65.5%. His 242 passing yards represented the majority of New York’s aerial production, and his 8.3 yards per attempt indicated that the Giants were gaining meaningful distance when he threw the ball.
Three details stand out:
- No passing touchdowns: Dart did not throw a touchdown pass despite generating 242 yards through the air.
- No interceptions: He avoided throwing an interception, preserving New York’s passing efficiency in that category.
- Two rushing touchdowns: His contribution as a runner made him the Giants’ most important individual scoring threat.
Dart also took two sacks for a combined loss of 12 yards. Those plays reduced the value of some of New York’s passing production, although they did not erase the strong average gain on his attempts.
His performance illustrates why quarterback evaluation should include both passing and rushing. Looking only at passing touchdowns would miss two of the Giants’ most important scoring plays.
Russell Wilson: Limited passing opportunities
Wilson finished with three completions on seven attempts for 45 yards. He did not throw a touchdown or an interception, but he took two sacks for 13 yards.
His seven attempts are a small sample, so the statistics do not support a broad conclusion about his overall ability. They do show that his passing contribution was considerably smaller than Dart’s.
Wilson’s late-game situation was especially important. Chicago’s defense eventually stopped New York on a fourth-down attempt, preserving the four-point lead. The official Bears recap identifies the final defensive stop as a key moment in the comeback.
Chicago Bears
Chicago Bears quarterback stats
| Player | Comp/Att | Pass Yds | Yards per Attempt | Pass TD | INT | Sacks Taken |
| Caleb Williams | 20/36 | 220 | 6.1 | 1 | 0 | 0 |
| Team total | 20/36 | 220 | 6.1 | 1 | 0 | 0 |
Williams completed 20 passes on 36 attempts, producing a completion rate of approximately 55.6%. His passing yardage was lower than Dart’s, but he delivered a touchdown pass to Rome Odunze during the fourth-quarter comeback.
His most valuable contribution was not limited to throwing. Williams also rushed for 63 yards and a touchdown. That combination gave Chicago another way to move the ball when its passing attack did not produce a high completion percentage.
Williams finished without an interception and was not sacked. Avoiding sacks helped Chicago preserve its passing yardage, while his mobility provided a direct scoring threat near the end of the game.
Comparing the two quarterbacks
| Category | Jaxson Dart | Caleb Williams |
| Passing yards | 242 | 220 |
| Completion percentage | 65.5% | 55.6% |
| Passing touchdowns | 0 | 1 |
| Interceptions | 0 | 0 |
| Rushing yards | 66 | 63 |
| Rushing touchdowns | 2 | 1 |
| Total passing and rushing yards | 308 | 283 |
| Total touchdowns responsible for | 2 | 2 |
The comparison is closer than the passing figures alone suggest. Dart gained 22 more passing yards, while Williams threw the only passing touchdown. Both quarterbacks added more than 60 rushing yards and scored twice when their rushing and passing touchdowns are combined.
There is an important distinction between yardage and scoring efficiency. Dart helped New York accumulate yards, but Chicago ultimately converted its late opportunities into enough points to win.
Rushing Stats: The Ground Game Nearly Cancelled Out
Both teams relied on their running games, and neither side established a decisive advantage in total rushing yardage. Chicago finished with 171 rushing yards on 28 attempts, while New York recorded 169 yards on 30 attempts.
The difference was how those yards were distributed among the players and used in scoring situations.
New York Giants rushing leaders
| Player | Carries | Rushing Yards | Average | Longest Run | Rushing TD |
| Tyrone Tracy Jr. | 14 | 71 | 5.1 | 16 | 0 |
| Jaxson Dart | 6 | 66 | 11.0 | 24 | 2 |
| Devin Singletary | 8 | 20 | 2.5 | 6 | 0 |
| Russell Wilson | 2 | 12 | 6.0 | 11 | 0 |
| Team total | 30 | 169 | 5.6 | 24 | 2 |
Tyrone Tracy Jr. provided steady production
Tracy carried the ball 14 times for 71 yards, averaging 5.1 yards per attempt. His workload made him New York’s leading conventional ball carrier by attempts and rushing yards.
An average above five yards per carry is a positive indicator of ground-game efficiency. Tracy gave the Giants a reliable source of rushing production without needing a single explosive run to account for most of his total.
He also caught one pass, although that reception produced no receiving yards. His primary statistical contribution came from running the ball.
Dart changed the rushing matchup
Dart’s six carries produced 66 yards, an average of 11.0 yards per attempt. He scored on runs of three and 24 yards, making him the Giants’ most productive rushing scorer.
His performance created a challenge for Chicago’s defense. A quarterback who can gain significant yardage on designed runs or scrambles forces defenders to account for an additional rushing threat rather than focusing exclusively on the running backs.
However, rushing production does not automatically translate into victory. New York’s two rushing touchdowns were valuable, but the Giants did not score a passing touchdown and finished with only three points in the fourth quarter.
Devin Singletary had a mixed contribution
Singletary gained 20 yards on eight carries, averaging 2.5 yards per attempt. That was the lowest average among New York’s listed runners.
His receiving performance was more productive. He caught three passes for 53 yards, including a 41-yard reception. This contrast shows why a running back’s overall contribution should not be assessed from rushing figures alone.
Chicago Bears rushing leaders
| Player | Carries | Rushing Yards | Average | Longest Run | Rushing TD |
| D’Andre Swift | 13 | 80 | 6.2 | 25 | 0 |
| Caleb Williams | 8 | 63 | 7.9 | 29 | 1 |
| Kyle Monangai | 7 | 28 | 4.0 | 9 | 1 |
| Team total | 28 | 171 | 6.1 | 29 | 2 |
D’Andre Swift led the Bears’ ground attack
Swift recorded 80 rushing yards on 13 carries, averaging 6.2 yards per attempt. His longest run covered 25 yards.
He was Chicago’s leading conventional rushing option and produced a higher average per carry than any of New York’s running backs. His ability to gain yardage helped the Bears maintain a balanced offense, even when Williams’ passing completion rate was modest.
Swift also caught five passes for 18 yards. Those short receptions added another way for Chicago to use him without requiring him to carry the ball.
Caleb Williams supplied the decisive rushing touchdown
Williams gained 63 yards on eight carries, averaging 7.9 yards per attempt. His longest run covered 29 yards, and his 17-yard rushing touchdown in the fourth quarter gave Chicago a 24-20 lead.
That score was particularly important because it followed the Bears’ touchdown pass to Odunze. Chicago went from trailing by 10 points to leading by four through two separate scoring drives in the final period.
Williams’ rushing contribution demonstrates how quarterback mobility can affect a close game. His ability to run was not merely a way to extend plays. It produced a touchdown that ultimately separated the teams.
Kyle Monangai opened the scoring
Monangai carried seven times for 28 yards and scored Chicago’s opening touchdown on an eight-yard run. His average was four yards per carry.
Although his overall rushing total was smaller than Swift’s or Williams’, his touchdown gave Chicago an early lead. In a game decided by four points, that opening score remained part of the final scoring margin.
Which team had the better rushing performance?
The raw numbers were almost identical, but Chicago had a slight advantage.
- Chicago gained two more rushing yards.
- Chicago averaged 6.1 yards per carry, compared with New York’s 5.6.
- Both teams scored two rushing touchdowns.
- New York’s quarterback scored both of its rushing touchdowns, while Chicago divided its rushing touchdowns between Williams and Monangai.
New York’s rushing attack was effective, particularly through Dart and Tracy. Chicago’s was marginally more efficient overall and contributed to the decisive late scoring sequence.
Receiving Stats: Who Led Each Team?
Receiving statistics help explain where quarterbacks directed the ball and which players created the most value after catches. In this matchup, the Giants gained more receiving yards, but Chicago produced the game’s only passing touchdown.
New York Giants receiving leaders
| Receiver | Receptions | Targets | Receiving Yards | Average per Catch | Longest Catch | TD |
| Darius Slayton | 4 | 4 | 89 | 22.3 | 38 | 0 |
| Theo Johnson | 7 | 8 | 75 | 10.7 | 25 | 0 |
| Wan’Dale Robinson | 6 | 11 | 62 | 10.3 | 15 | 0 |
| Devin Singletary | 3 | 3 | 53 | 17.7 | 41 | 0 |
| Daniel Bellinger | 1 | 2 | 8 | 8.0 | 8 | 0 |
| Tyrone Tracy Jr. | 1 | 2 | 0 | 0.0 | 0 | 0 |
| Gunner Olszewski | 0 | 2 | 0 | 0.0 | 0 | 0 |
| Team total | 22 | 32 | 287 | 13.0 | 41 | 0 |
The Giants’ 287 receiving yards were their gross passing yardage total before accounting for sack losses. Their net passing yardage was 262.
Darius Slayton delivered the biggest receiving total
Slayton caught four passes for 89 yards, averaging 22.3 yards per reception. His longest catch went for 38 yards.
He led the Giants in receiving yards despite seeing only four targets. Catching all four targets for 89 yards is a strong statistical return and indicates that New York generated substantial gains on the opportunities directed his way.
His production also highlights the difference between receiving yardage and scoring impact. Slayton gained more yards than any other Giants receiver, but he did not score a touchdown.
Theo Johnson offered a reliable target
Johnson recorded seven catches for 75 yards on eight targets. His 87.5% catch rate was the highest among the Giants’ principal receiving options with multiple targets.
His seven receptions led New York’s receivers in catches. That made him a significant part of the passing game’s volume, even though his average gain per catch was lower than Slayton’s.
Johnson’s figures are especially useful when evaluating consistency. A receiver does not need a long touchdown catch to contribute. Repeated successful receptions can keep drives moving and help an offense reach scoring range.
Wan’Dale Robinson handled a high target volume
Robinson caught six passes for 62 yards on 11 targets. His catch rate was approximately 54.5%, lower than Johnson’s and Slayton’s.
That difference should be interpreted carefully. Target volume alone does not reveal whether a receiver was open, whether a pass was catchable, or what coverage he faced. Still, the box score shows that Robinson was an important part of New York’s passing plan.
Devin Singletary added value as a receiver
Singletary caught three passes for 53 yards, averaging 17.7 yards per reception. His longest catch was 41 yards.
Combined with his 20 rushing yards, he produced 73 yards from scrimmage. His receiving work was therefore a much larger part of his overall contribution than his rushing total suggests.
Chicago Bears receiving leaders
| Receiver | Receptions | Targets | Receiving Yards | Average per Catch | Longest Catch | TD |
| Rome Odunze | 6 | 10 | 86 | 14.3 | 27 | 1 |
| Colston Loveland | 4 | 4 | 55 | 13.8 | 20 | 0 |
| Luther Burden III | 3 | 3 | 51 | 17.0 | 27 | 0 |
| D’Andre Swift | 5 | 8 | 18 | 3.6 | 10 | 0 |
| Olamide Zaccheaus | 1 | 4 | 5 | 5.0 | 5 | 0 |
| Cole Kmet | 1 | 2 | 5 | 5.0 | 5 | 0 |
| D.J. Moore | 0 | 4 | 0 | 0.0 | 0 | 0 |
| Kyle Monangai | 0 | 1 | 0 | 0.0 | 0 | 0 |
| Team total | 20 | 36 | 220 | 11.0 | 27 | 1 |
Rome Odunze was Chicago’s most important receiver
Odunze caught six passes for 86 yards and scored one touchdown. He averaged 14.3 yards per catch, and his longest reception covered 27 yards.
His receiving total was just three yards below Slayton’s team-leading figure for New York. The major difference was the touchdown. Odunze caught Williams’ two-yard touchdown pass in the fourth quarter, cutting New York’s lead from 10 points to three.
That reception was the turning point of the comeback. It reduced the deficit and gave Chicago an opportunity to take the lead with another successful drive.
Colston Loveland contributed consistent gains
Loveland caught all four of his targets for 55 yards. His 13.8 yards per reception showed that Chicago could generate meaningful gains through its passing options beyond Odunze.
A four-for-four performance is a clean receiving result. It indicates that every recorded target to Loveland resulted in a catch, although the box score alone cannot establish how difficult those catches were.
Luther Burden III added explosive receiving production
Burden recorded three receptions for 51 yards, averaging 17 yards per catch. His longest catch was 27 yards.
His three receptions produced more than 50 yards, giving Chicago another option capable of generating substantial gains without requiring a large target share.
Receiving comparison: Giants vs Bears
New York finished with 287 gross receiving yards, while Chicago recorded 220. The Giants had more receptions, more gross receiving yards, and a higher average per catch.
However, Chicago’s passing game produced one touchdown, while New York’s produced none.
This distinction is central to understanding the final result. New York’s receivers moved the ball effectively, but the Bears converted one of their receiving opportunities into a crucial touchdown. The statistical advantage in yardage did not produce an equivalent advantage on the scoreboard.
Defensive Player and Team Statistics
Offensive statistics explain how teams gained yards and scored, but defensive performance often determines whether those gains become points. Chicago’s defensive numbers reveal one of the clearest differences between the two sides.
Team defensive comparison
| Defensive statistic | New York Giants | Chicago Bears |
| Total tackles | 64 | 68 |
| Solo tackles | 32 | 39 |
| Sacks | 0 | 4 |
| Tackles for loss | 2 | 7 |
| Passes defended | 2 | 5 |
| Quarterback hits | 3 | 9 |
| Interceptions | 0 | 0 |
| Defensive touchdowns | 0 | 0 |
Chicago registered four sacks, seven tackles for loss, and nine quarterback hits. New York did not record a sack and finished with three quarterback hits.
These figures indicate that the Bears created more disruption around the line of scrimmage and applied more pressure to New York’s quarterbacks.
Why Chicago’s pass rush mattered
The Giants averaged 8.0 gross passing yards per attempt, a productive figure. However, they also lost 25 yards on four sacks. Those losses reduced their net passing production to 262 yards.
A sack does more than subtract yardage. It can also disrupt offensive timing, create longer conversion situations, and force an offense to change its approach on later downs.
Chicago’s four sacks were especially relevant because New York was trying to protect a fourth-quarter lead. The Bears needed to prevent the Giants from sustaining drives, and their defensive pressure helped limit New York’s opportunities to respond.
The Giants’ defense, by contrast, did not record a sack against Williams. His ability to avoid sacks gave Chicago more freedom to operate its passing game and maintain its offensive rhythm.
It would be inaccurate to attribute the entire outcome to the pass rush alone. Chicago also benefited from better red-zone execution and two late touchdowns. Nevertheless, the difference in sacks and quarterback hits is a meaningful part of the statistical explanation.
Tackles for loss and quarterback hits
Chicago recorded seven tackles for loss, compared with two for New York. A tackle for loss occurs when a defender stops a ball carrier behind the line of scrimmage, excluding sacks in the usual statistical distinction.
These plays can erase positive rushing gains and make the next down more difficult. Chicago’s total suggests that its defense was more successful at disrupting offensive plays before they developed.
The Bears also registered nine quarterback hits. That number indicates repeated contact with New York’s passers, although quarterback hits and sacks are different statistics and should not be treated as interchangeable.
Turnovers and fumbles
Neither team recorded an interception. The Giants did, however, lose one fumble, while Chicago did not lose a fumble.
Turnovers are often decisive in close NFL games because they can end a promising possession or give the opposing offense an opportunity to score without needing to drive the full length of the field.
The available box-score data records a lost fumble for New York, but the final result cannot be explained by turnovers alone. Chicago’s defensive pressure and red-zone performance also played important roles.
Team Statistics: Giants vs Bears at a Glance
The overall team numbers reveal a particularly interesting contrast: New York gained more total net yards, but Chicago scored more points.
| Team statistic | New York Giants | Chicago Bears |
| First downs | 21 | 23 |
| Total net yards | 431 | 391 |
| Offensive plays | 70 | 64 |
| Average yards per play | 6.2 | 6.1 |
| Net rushing yards | 169 | 171 |
| Net passing yards | 262 | 220 |
| Third-down conversions | 5/14 | 3/11 |
| Fourth-down conversions | 1/4 | 1/4 |
| Red-zone efficiency | 1/4 | 3/4 |
| Penalties | 10 | 3 |
| Penalty yards | 69 | 25 |
| Turnovers lost | 1 | 0 |
| Time of possession | 31:18 | 28:42 |
| Final score | 20 | 24 |
Team totals and situational figures are drawn from the official NFL game statistics. Red-zone efficiency is shown as successful scoring conversions divided by opportunities.
New York gained more total yards but scored fewer points
The Giants finished with 431 net yards, compared with Chicago’s 391. New York also ran six more offensive plays and averaged 6.2 yards per play, slightly ahead of Chicago’s 6.1.
Those numbers suggest that New York moved the ball efficiently overall. Yet total yardage does not account for where a team gains its yards or whether those gains end in touchdowns.
A team can accumulate yards between the 20-yard lines but struggle once it reaches the red zone. That was a major difference in this matchup.
Red-zone efficiency explains much of the scoring gap
New York converted one of four red-zone opportunities, a 25% rate. Chicago converted three of four, a 75% rate.
The 50-percentage-point difference is striking. Both teams produced substantial yardage, but Chicago was far more successful when it moved close to the goal line.
Red-zone efficiency does not tell the full story of every possession, and a successful scoring opportunity can result in a field goal rather than a touchdown. Even so, the figures help explain why Chicago scored 24 points with fewer total yards.
For the Giants, improving the ability to turn productive drives into touchdowns would have been more valuable than simply adding more between-the-tackles yardage or short receptions.
Penalties gave the Giants another obstacle
New York was penalized 10 times for 69 yards, compared with three penalties for 25 yards for Chicago.
That difference represents seven additional penalties and 44 more penalty yards for the Giants. Penalties can erase successful plays, create longer down-and-distance situations, and give opponents opportunities to extend drives.
Not all penalties have the same impact. A holding penalty on an important third down, for example, can be more damaging than a penalty that does not change the next down’s difficulty. The aggregate figures do not identify the precise impact of each flag, but they show that discipline was a clear area of difference.
Third-down numbers were not the deciding factor
New York converted five of 14 third downs, approximately 35.7%. Chicago converted three of 11, approximately 27.3%.
The Giants therefore performed better on third down by conversion rate. This is another reason not to judge the game by one statistic alone.
New York’s advantage in third-down efficiency did not offset its struggles in the red zone, its lost fumble, its penalties, or Chicago’s late scoring surge. The combined numbers provide a more complete explanation than any single category.
Fourth-Quarter Comeback: How Chicago Won 24-20
The scoring sequence provides the clearest account of the final result.
First quarter: Chicago takes the lead
Chicago scored first when Monangai ran eight yards for a touchdown. Cairo Santos added the extra point, giving the Bears a 7-0 advantage.
The opening score allowed Chicago to begin the game in control, but the Bears did not extend that lead during the second quarter.
Second quarter: New York responds
Dart scored on a three-yard rushing touchdown to tie the game at 7-7. Younghoe Koo’s extra point completed the scoring play.
Later, Koo converted a 32-yard field goal, putting the Giants ahead 10-7 at halftime.
New York’s ability to score through both a quarterback run and a field goal demonstrated its capacity to move the ball and capitalize on available scoring chances.
Third quarter: Dart extends the Giants’ lead
Dart scored again on a 24-yard run, increasing New York’s advantage to 17-7.
Chicago answered with a 22-yard field goal by Santos, cutting the deficit to 17-10 entering the fourth quarter.
At this point, New York had scored 17 unanswered points after trailing 7-0. The Giants appeared to have gained control, but the remaining quarter changed the outcome.
Fourth quarter: Chicago scores twice
Koo made a 19-yard field goal to extend New York’s lead to 20-10.
Chicago then produced the comeback that decided the game:
- Rome Odunze’s touchdown reception: Williams connected with Odunze for a two-yard touchdown. Santos’ extra point made it 20-17.
- Caleb Williams’ rushing touchdown: After Chicago’s defense forced New York into a three-and-out, Williams ran 17 yards for a touchdown. The successful extra point gave Chicago a 24-20 lead.
The Bears then defended their advantage. With 38 seconds remaining, linebacker Tremaine Edmunds pressured Wilson on a fourth-and-10 play, forcing an incompletion and ending New York’s final attempt to continue the drive.
Chicago Bears
The decisive sequence in context
The Bears scored 14 points in the fourth quarter, while the Giants scored three. That difference explains the final margin directly.
Chicago’s comeback was not the result of one unusually long passing touchdown. It came through a combination of a touchdown pass, a quarterback rushing score, and a defensive stop.
This is a useful distinction for anyone analyzing football statistics. Big yardage totals can demonstrate offensive capability, but late-game execution determines whether a team can protect a lead or complete a comeback.
Special Teams Statistics
Special teams were not the main story of this game, but the kicking and return numbers help complete the statistical picture.
Kicking performance
| Kicker | Field Goals | Extra Points | Total Points |
| Younghoe Koo, Giants | 2/2 | 2/2 | 8 |
| Cairo Santos, Bears | 1/1 | 3/3 | 6 |
Koo converted field goals from 32 and 19 yards and made both extra points. Santos made his 22-yard field goal and converted all three extra points.
Both kickers were perfect on their recorded attempts. New York’s kicker scored more points because the Giants made two field goals, while Chicago scored three touchdowns and needed only one field goal.
The difference reinforces the importance of touchdowns. A successful field goal can keep a team competitive, but a touchdown generally creates a larger scoring return from a successful drive.
Punting comparison
| Statistic | Jamie Gillan, Giants | Tory Taylor, Bears |
| Punts | 3 | 3 |
| Gross punting yards | 110 | 135 |
| Average punt distance | 36.7 yards | 45.0 yards |
| Longest punt | 54 yards | 59 yards |
| Punts inside the 20 | 1 | 1 |
| Touchbacks | 0 | 2 |
Taylor averaged 45.0 yards per punt, compared with Gillan’s 36.7. However, gross punting distance does not measure every aspect of field position, because returns, hang time, and touchbacks can affect the final result.
Both punters placed one punt inside the opponent’s 20-yard line. The figures show a distance advantage for Chicago, but they do not establish that punting alone decided the game.
Kick and punt returns
| Return statistic | New York Giants | Chicago Bears |
| Kickoff returns | 1 | 2 |
| Kickoff return yards | 39 | 46 |
| Longest kickoff return | 39 yards | 23 yards |
| Punt returns | 0 | 1 |
| Punt return yards | 0 | 13 |
Deonte Banks returned one kickoff for 39 yards for New York. Chicago’s Devin Duvernay returned two kickoffs for 46 yards and one punt for 13 yards.
New York had the longer individual kickoff return, while Chicago recorded more total kickoff return yards and the only punt return. These figures provide context for field-position opportunities without suggesting that return yardage was the principal reason for the result.
Key Player Performances and Their Statistical Meaning
The most useful way to evaluate individual performances is to consider how each player affected scoring, field position, and the opposing team’s defensive decisions.
Jaxson Dart: New York’s dual-threat leader
Dart finished with 242 passing yards and 66 rushing yards. He scored twice on the ground and did not throw an interception.
His combined 308 passing and rushing yards made him the Giants’ leading statistical contributor in total quarterback yardage. However, he did not throw a touchdown pass, and New York struggled to convert its red-zone opportunities into touchdowns.
His performance was productive without being sufficient to secure the victory. That distinction matters when evaluating quarterbacks: individual efficiency and team success are related, but they are not identical.
Caleb Williams: The comeback’s central figure
Williams combined 220 passing yards with 63 rushing yards. He threw a touchdown to Odunze and scored another touchdown himself on a 17-yard run.
His total of 283 passing and rushing yards was lower than Dart’s, but his fourth-quarter production directly changed the scoreboard. Williams’ performance is a strong example of why timing and scoring impact matter alongside cumulative yardage.
D’Andre Swift: Chicago’s rushing foundation
Swift’s 80 rushing yards led all players in the game. He averaged 6.2 yards per carry and added 18 receiving yards.
His total of 98 yards from scrimmage made him a major part of Chicago’s offensive production. Although he did not score a touchdown, his rushing efficiency helped the Bears maintain a balanced attack.
Rome Odunze: The most important receiving score
Odunze caught six passes for 86 yards and one touchdown. His two-yard scoring reception brought Chicago within three points in the fourth quarter.
His overall receiving yardage was slightly lower than Slayton’s, but Odunze’s touchdown had a more direct effect on the result. The contrast demonstrates why receiving yards and receiving touchdowns should be assessed together.
Tyrone Tracy Jr.: A productive supporting runner
Tracy gained 71 yards on 14 carries, averaging 5.1 yards per attempt. He provided consistent production behind Dart’s more explosive rushing performance.
His contribution helped New York finish with 169 rushing yards. Yet the Giants needed greater scoring efficiency to turn that yardage into a winning result.
What the Statistics Reveal About Both Teams
The game offers several useful lessons for evaluating NFL performances beyond the final score.
1. Total yards do not guarantee victory
New York outgained Chicago by 40 yards, finishing with 431 total net yards to the Bears’ 391. The Giants also averaged slightly more yards per offensive play.
Nevertheless, Chicago scored four more points. The result demonstrates that total yardage measures movement, not the quality of every scoring opportunity.
2. Red-zone performance can outweigh offensive volume
The Giants converted one of four red-zone opportunities, while the Bears converted three of four. Chicago’s 75% conversion rate gave it a significant advantage when drives reached scoring range.
For analysts, this is a more meaningful comparison than looking at total yards alone. The ability to finish possessions is essential to converting offensive production into points.
3. Quarterback rushing can change defensive priorities
Dart and Williams each exceeded 60 rushing yards and scored multiple touchdowns when passing and rushing scores are combined.
Their mobility affected how the opposing defenses had to respond. Defenders needed to account for both the passing game and the possibility of a quarterback carrying the ball.
4. Defensive pressure matters most when the offense needs a stop
Chicago recorded four sacks and nine quarterback hits. Its defense also forced a three-and-out during the fourth-quarter comeback and stopped New York’s final fourth-down attempt.
These plays helped protect the lead after Williams’ rushing touchdown. Defensive production is particularly valuable when the opposing offense has limited time to recover from a deficit.
5. Penalties and ball security can undermine good offense
The Giants committed 10 penalties for 69 yards and lost one fumble. Chicago had three penalties for 25 yards and no lost fumbles.
The Giants still produced more total yards, but their additional penalties and lost fumble created avoidable obstacles. The available numbers do not prove that any single penalty or turnover determined the result, but they identify important areas that affected the overall performance.
How to Read an NFL Box Score Correctly
For readers who regularly check player statistics, understanding the difference between individual and team figures is essential.
Passing yards versus net passing yards
A quarterback’s passing yards generally count the yards gained on completed passes. Team net passing yards account for yardage lost on sacks.
That distinction explains why New York’s players combined for 287 gross passing yards while the team finished with 262 net passing yards. The 25-yard difference came from four sacks.
Yards per attempt versus completion percentage
Completion percentage measures the proportion of passes completed. Yards per attempt measures passing yardage relative to pass attempts.
Dart’s 65.5% completion rate and 8.3 yards per attempt indicate that he completed a solid share of his passes and gained substantial yardage on those attempts. Williams’ 55.6% completion rate and 6.1 yards per attempt were lower, but his touchdown pass and rushing production helped Chicago win.
Neither statistic independently captures every part of quarterback performance.
Rushing yards versus total yards from scrimmage
Rushing yards measure production on running plays, while total yards from scrimmage combine rushing and receiving yards.
For example, Swift’s 80 rushing yards and 18 receiving yards produced 98 yards from scrimmage. Singletary’s 20 rushing yards and 53 receiving yards produced 73.
These combined figures provide a more complete view of running backs who contribute both as ball carriers and receivers.
Touchdowns versus total points
A touchdown does not always contribute six points to a player’s individual scoring total in the same way across all statistical categories. A rushing touchdown is credited to the runner, while a passing touchdown is credited to the passer and receiver according to their respective statistical records.
For this game, Dart had two rushing touchdowns and no passing touchdowns. Williams had one passing touchdown and one rushing touchdown. Odunze had one receiving touchdown.
These are different statistical credits for related scoring plays, so analysts should avoid adding them together as if each touchdown represented a separate team score.
Official Box Score and Source Verification
The figures discussed here are based on the supplied ESPN box-score data and corroborating game records. For the official game record, readers can consult the Chicago Bears’ Giants vs Bears box score.
When comparing statistics across sports websites, it is worth checking whether a source displays gross passing yards or net passing yards, whether quarterback rushing is included in total offense, and whether the listed team record reflects the point in the season immediately after the game.
These details help prevent apparent discrepancies between box scores and summary articles.
Frequently Asked Questions
1. What was the final score of the Giants vs Bears game on November 9, 2025?
The Chicago Bears defeated the New York Giants 24-20. Chicago scored 14 points in the fourth quarter to overcome a 20-10 deficit.
2. How many passing yards did Jaxson Dart record against the Bears?
Jaxson Dart recorded 242 passing yards on 19 completions from 29 attempts. He threw no passing touchdowns and no interceptions, while adding 66 rushing yards and two rushing touchdowns.
3. How many passing yards did Caleb Williams have?
Caleb Williams completed 20 of 36 passes for 220 yards, one touchdown, and no interceptions. He also rushed for 63 yards and one touchdown.
4. Who led the Giants and Bears in rushing yards?
D’Andre Swift led all players with 80 rushing yards for Chicago. Tyrone Tracy Jr. led New York’s running backs with 71 yards, while Dart added 66 yards as a runner.
5. Who was the leading receiver in the Giants vs Bears game?
Darius Slayton led all receivers with 89 receiving yards on four catches for New York. Rome Odunze led Chicago with 86 yards on six receptions and recorded the game’s only receiving touchdown.
6. Why did the Bears win despite gaining fewer total yards?
Chicago gained 391 total net yards compared with New York’s 431, but the Bears converted three of four red-zone opportunities, recorded four sacks, and scored 14 fourth-quarter points. New York converted only one of four red-zone opportunities and lost one fumble.
Conclusion
The November 9, 2025, matchup between the New York Giants and Chicago Bears demonstrated how offensive production, defensive pressure, and late-game execution combine to determine an NFL result. Chicago won 24-20 despite gaining fewer total net yards, finishing with 391 compared with New York’s 431.
Jaxson Dart delivered an impressive dual-threat performance with 242 passing yards, 66 rushing yards, and two rushing touchdowns. Tyrone Tracy Jr. added 71 rushing yards, while Darius Slayton led the Giants’ receivers with 89 yards. For Chicago, Caleb Williams combined 220 passing yards with 63 rushing yards and two total touchdowns. D’Andre Swift led the ground game with 80 rushing yards, and Rome Odunze recorded 86 receiving yards and the Bears’ only receiving touchdown.
The most important statistical differences were Chicago’s four sacks, its 75% red-zone conversion rate, and its 14-point fourth quarter. New York generated more total offense but converted only one of four red-zone opportunities and committed more penalties.
Ultimately, this game illustrates why player statistics should be evaluated together rather than in isolation. Yardage measures production, touchdowns measure scoring contributions, and situational statistics help explain how those contributions influence the final result.